
Conductive Plastic Validation: Pellet, Plaque and Real Part Data Hierarchy
Conductive plastic approval should not stop at supplier pellet data or flat plaque coupons. Real molded parts reveal gate-to-end variation, weld-line resistance, cleaning effects and processing risk.
Buyer and quality engineer FAQ
Questions before approving conductive plastic data
Why are pellet data and plaque data not enough?
Pellet and plaque data are measured under controlled or simplified conditions. They do not capture gate position, weld lines, filler orientation, skin-core effects, cleaning cycles or assembly stress on the actual molded part.
What is the most important validation level?
Real part data is the only reliable predictor for production approval. Pellet data is for screening, plaque data is for baseline comparison, and real part data confirms the actual application.
Which DEYU product is linked as the closest reference?
The case discusses conductive PA66 test sockets. There is no exact socket product page, so the closest existing reference is DGK-PA66 CF15L-CF40L, selected as a similar PA66 engineering component material.
How many parts should be tested in validation?
A practical protocol molds 20-50 production-equivalent parts, conditions them, measures 5-10 resistance locations per part, then adds cleaning, thermal cycling, wear and dimensional checks on selected samples.
The three-level validation hierarchy
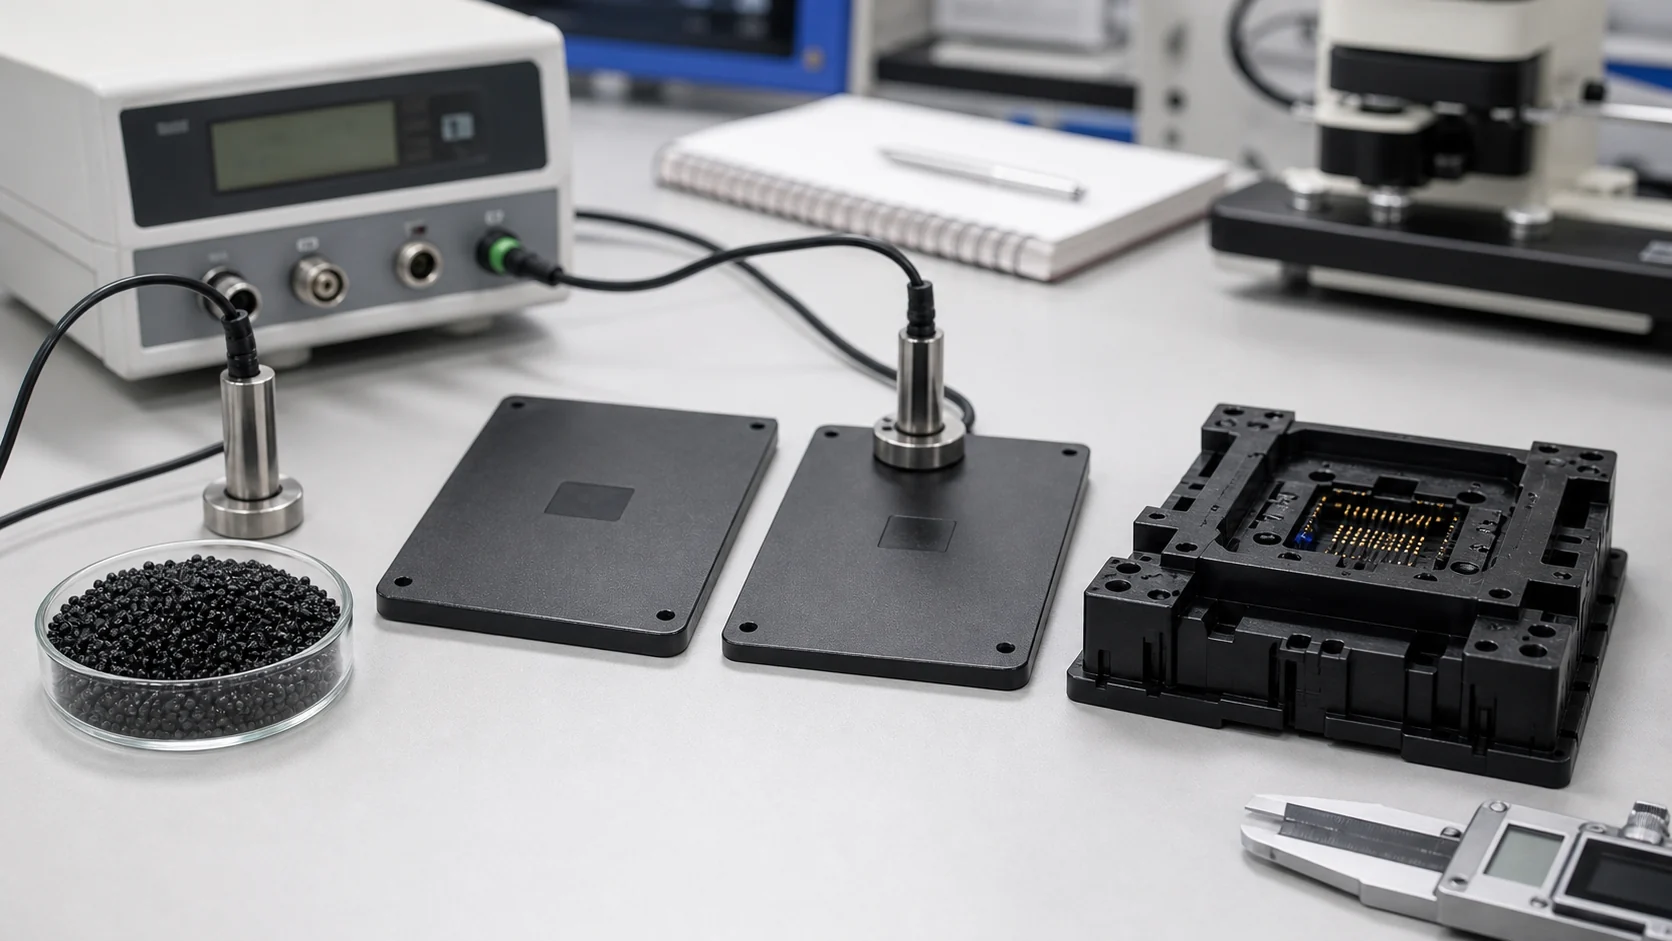
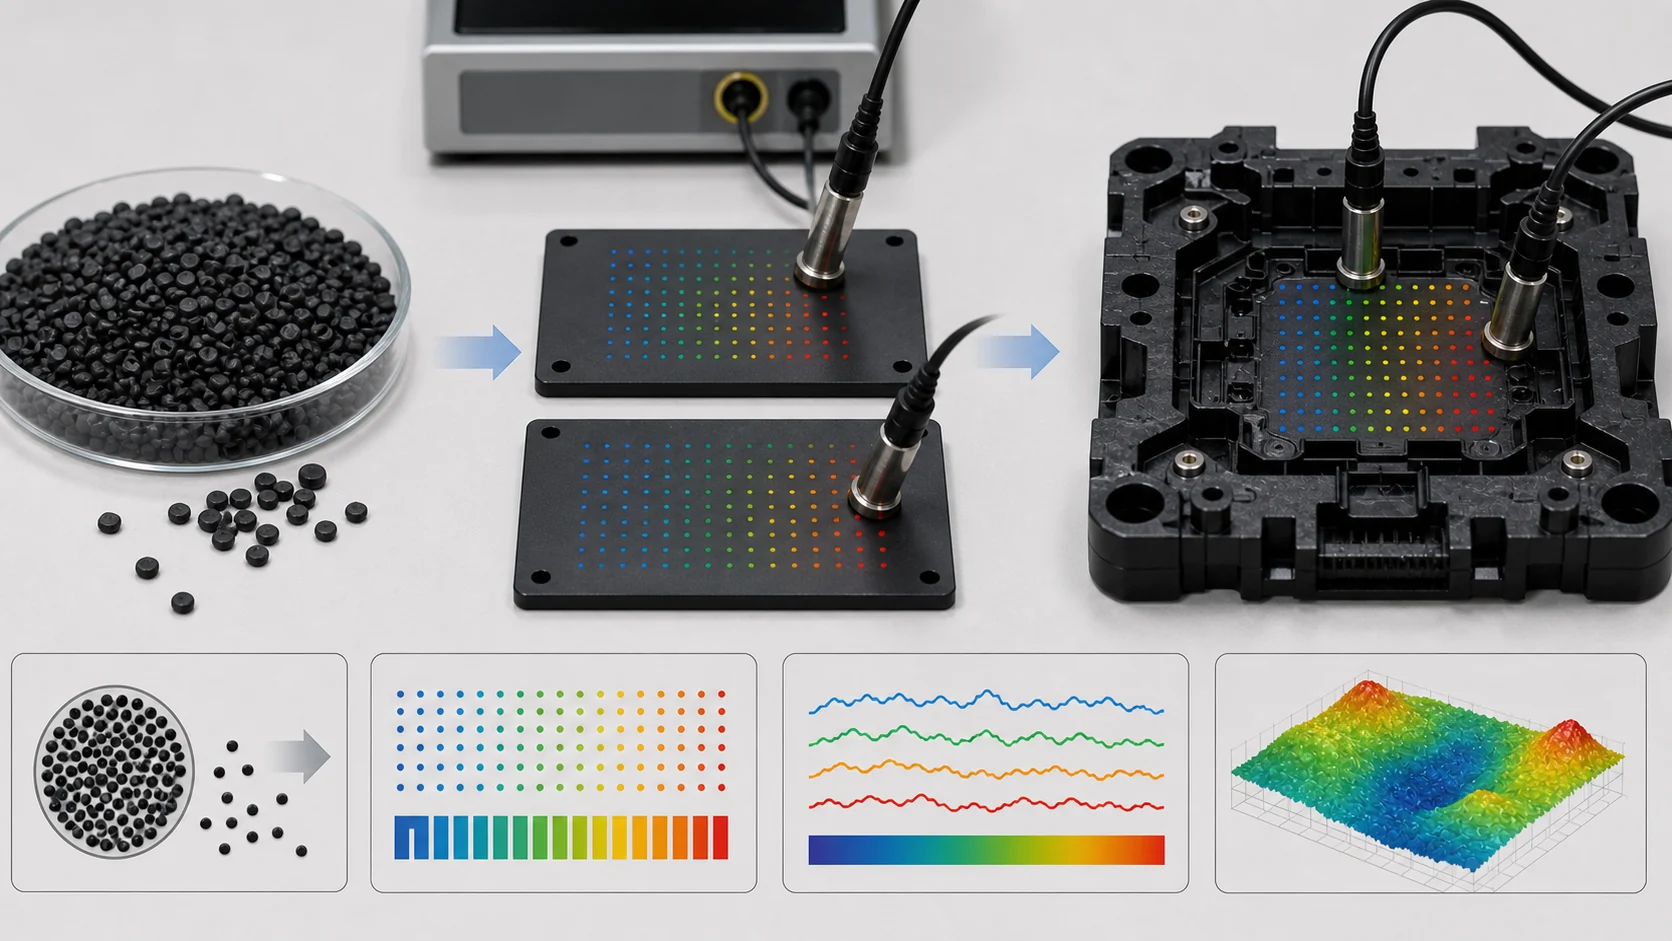
When qualifying a conductive plastic for an ESD-safe component, engineers usually receive three kinds of evidence: supplier pellet data, molded plaque or coupon data, and real molded part data. Each level has a purpose, but none should be treated as a complete approval package alone. Pellet data starts the discussion, plaque data checks a simple geometry, and real part data includes geometry, gate location, weld lines, wall thickness, processing settings and service environment.
Level 1: pellet data
Pellet data comes from supplier datasheets and certificates of analysis. It is useful for initial screening, procurement specification, baseline reference and incoming batch checks. Its limitation is that it cannot tell how resistance changes from gate to end-of-fill, what happens at weld lines, or whether the material remains in range after cleaning, thermal cycling or assembly stress.
Level 2: plaque data
Plaque testing uses molded coupons from the same material batch. It verifies supplier data, supports incoming quality control and establishes baseline processing values. Plaques are still simplified shapes, so a plaque can show 10^7 ohm while the final part reaches 10^9 ohm at a weld line.
Level 3: real part data
Real part testing captures geometry, flow, processing, skin-core structure, residual stress, cleaning exposure and assembly load. For complex conductive parts, this is the decisive validation level. For the semiconductor socket case, the closest existing DEYU reference is DGK-PA66 CF15L-CF40L carbon fiber reinforced PA66 pellets; it is a similar PA66 engineering component material, so no new product page is created.
Reference validation tables
The following tables retain the English source data for the validation hierarchy, acceptance criteria and customer case. Category rows are filled intentionally so the table has no missing cells.
| Level | Data Type | Source | What It Tells You |
|---|---|---|---|
| Level 1 | Pellet data | Supplier datasheet | Intrinsic material properties under ideal conditions |
| Level 2 | Plaque data | In-house testing on molded coupons | Material properties in a standardized geometry |
| Level 3 | Real part data | Testing on actual molded parts | Material performance in the actual application geometry |
| Property | Test Method | What It Shows |
|---|---|---|
| Surface resistivity | ANSI/ESD STM11.11 | Intrinsic surface conductivity of the material |
| Volume resistivity | ASTM D257 | Intrinsic bulk conductivity |
| MFR (melt flow rate) | ASTM D1238 | Processability, flow characteristics |
| Tensile strength | ASTM D638 | Basic strength under tension |
| Flexural modulus | ASTM D790 | Stiffness of the material |
| Notched impact strength | ISO 180/ASTM D256 | Toughness, brittleness |
| HDT (heat deflection temperature) | ISO 75 | Thermal stability |
| UL94 flammability | UL94 | Fire safety rating |
| Density | ASTM D792 | Weight per unit volume |
| Limitation | Why It Matters | Example |
|---|---|---|
| Idealized conditions | Lab conditions differ from production | Pellet data shows resistivity at 23°C/50% RH; production may be 35°C/30% RH |
| Standardized geometry | Coupons are not parts | Flow conditions, gate effects, weld lines, and skin-core structure are absent |
| Single-point measurements | No consideration of variation | Pellet data shows one value; actual parts vary across the part and across batches |
| No processing effects | Molding conditions affect properties | Injection speed, temperature, and pressure change filler orientation and resistivity |
| Purpose | Why It Matters |
|---|---|
| Verification of supplier data | Confirms that the material batch meets specification |
| Incoming quality control | Checks consistency of incoming shipments |
| Comparative evaluation | Compares different material candidates under the same conditions |
| Process development | Establishes baseline processing parameters |
| Gap | Plaque Data | Real Part Reality |
|---|---|---|
| Geometry | Flat, uniform thickness | Variable wall thickness, ribs, bosses, weld lines |
| Flow conditions | Simple, balanced flow | Complex flow with gates, weld lines, flow front variations |
| Filler orientation | Less oriented (some orientation) | Highly oriented in flow direction; varying across part |
| Skin-core structure | Present, but simpler | Complex skin-core structure with variable thickness |
| Gate effects | Minimal (often edge-gated) | Significant near-gate effects on resistivity |
| Stress distribution | Minimal residual stress | Significant residual stress from cooling and packing |
| Environmental exposure | Lab conditions | Cleaning, thermal cycling, chemical exposure, UV |
| Factor | Why It Matters |
|---|---|
| Complex geometry | Flow patterns, filler orientation, and resistivity vary with geometry |
| Gate-to-end variation | Resistivity can vary by 1–3 orders from gate to end-of-fill |
| Weld lines | Resistivity is significantly higher at weld lines |
| Skin-core effects | Surface resistivity may differ from bulk resistivity |
| Processing sensitivity | The material's response to your specific processing conditions |
| Application-specific performance | The only way to validate ESD performance in your application |
| Test | What It Validates | Method |
|---|---|---|
| Multi-point surface resistivity | Uniformity across the part | ANSI/ESD STM11.11 at 5–10 locations per part |
| Critical surface resistivity | Performance on functional surfaces | ANSI/ESD STM11.11 on contact surfaces |
| Resistance to ground (if applicable) | Grounding performance | ANSI/ESD S4.1 (for work surfaces) |
| Post-cleaning resistivity | Cleaning resistance | 50–100 IPA wipe cycles |
| Post-thermal cycling resistivity | Thermal stability | -40°C to +85°C, 100+ cycles |
| Post-wear resistivity | Abrasion resistance | 10,000+ wear cycles |
| Dimensional stability | Part geometry after processing | Precision measurement |
| Assembly performance | Snap-fit, press-fit, or other assembly | Assembly fixture testing |
| Step | Action | Sample Size | Acceptance Criteria |
|---|---|---|---|
| 1 | Mold parts under production-equivalent conditions | 20–50 parts | Consistent process parameters |
| 2 | Condition parts at 23°C / 50% RH for 48+ hours | All parts | Environmental control |
| 3 | Measure surface resistivity at 5–10 locations per part | All parts | All locations within specification |
| 4 | Measure resistance to ground (if applicable) | 3 parts | < 1×10⁹ Ω |
| 5 | Perform cleaning resistance test | 5 parts | Resistivity remains in specification |
| 6 | Perform thermal cycling test | 5 parts | Resistivity remains in specification |
| 7 | Perform wear resistance test | 5 parts | Resistivity remains in specification |
| 8 | Measure dimensional stability | 10 parts | Within drawing tolerances |
| 9 | Analyze data (mean, range, pass/fail) | All parts | ≥ 95% pass rate |
| Aspect | Pellet Data | Plaque Data | Real Part Data |
|---|---|---|---|
| Reliability | Low (idealized) | Medium (standardized) | High (application-specific) |
| Cost | Low (no testing) | Medium (molding plaques) | High (molding parts, testing) |
| Time | Immediate | Days | Weeks |
| Predictive value | Low | Medium | High |
| ESD performance validation | None | Partial | Complete |
| Measurement | Pellet Data (Supplier) | Plaque Data (In-house) | Real Part Data |
|---|---|---|---|
| Surface resistivity (gate area) | 10⁷ Ω | 10⁷ Ω | 10⁷ Ω |
| Surface resistivity (center) | 10⁷ Ω | 10⁷ Ω | 5×10⁷ Ω |
| Surface resistivity (end-of-fill) | 10⁷ Ω | 10⁷ Ω | 3×10⁸ Ω |
| Surface resistivity (weld line) | Not measured | Not measured | 5×10⁸ Ω |
| Surface resistivity (after cleaning) | Not measured | Not measured | 8×10⁸ Ω |
| Part-to-part variation | Not measured | ±0.3 orders | ±0.8 orders |
| Phase | Activity | Data Level | Purpose |
|---|---|---|---|
| Phase 1 | Review supplier datasheet | Pellet data | Initial screening, specification setting |
| Phase 2 | Mold and test plaques | Plaque data | Verify supplier data, establish baseline |
| Phase 3 | Mold real parts under production conditions | Real part data | Validate performance on actual geometry |
| Phase 4 | Test real parts after environmental exposure | Real part data | Validate durability and long-term performance |
| Phase 5 | Analyze data and make final decision | All data | Material approval or rejection |
| Level | Acceptance Criteria | Action |
|---|---|---|
| Pellet data | Within supplier specification | Proceed to plaque testing |
| Plaque data | Within ±0.5 orders of pellet data | Proceed to real part testing |
| Real part data | All locations within specification; < 5% part failure | Approve material |
| Environmental data | Remains within specification | Approve for production |
| Data Level | Documentation Required |
|---|---|
| Pellet data | Supplier datasheet, COA (Certificate of Analysis) |
| Plaque data | Test results with environmental conditions (temperature, humidity) |
| Real part data | Test results with part identification, locations, environmental conditions |
| Environmental data | Test results before and after exposure |
| Aspect | Plaque Data | Real Part Data | Difference |
|---|---|---|---|
| Surface resistivity (gate area) | 10⁵ Ω | 10⁵ Ω | 1× |
| Surface resistivity (center) | 10⁵ Ω | 10⁶ Ω | 10× |
| Surface resistivity (end-of-fill) | 10⁵ Ω | 10⁸ Ω | 1000× |
| Surface resistivity (weld line) | Not measured | 10⁹ Ω | Not measured |
| Part-to-part variation | ±0.2 orders | ±1.2 orders | 6× |
| Parameter | Plaque Data | Real Part Data (After Correction) | Specification |
|---|---|---|---|
| Surface resistivity—gate area | 10⁵ Ω | 10⁵ Ω | <10⁶ Ω |
| Surface resistivity—center | 10⁵ Ω | 10⁶ Ω | <10⁶ Ω |
| Surface resistivity—end-of-fill | 10⁵ Ω | 10⁷ Ω | <10⁶ Ω |
| Surface resistivity—weld line | Not measured | 10⁸ Ω | <10⁶ Ω |
| Part-to-part variation | ±0.2 orders | ±0.4 orders | <0.5 orders |
| ESD failure rate | 0% | 0.5% | <1% |
| Level | Data Type | Purpose | Sufficiency |
|---|---|---|---|
| Level 1 | Pellet data | Initial screening, specification setting | Insufficient alone |
| Level 2 | Plaque data | Verification of supplier data, baseline comparison | Insufficient for complex parts |
| Level 3 | Real part data | Performance validation on actual geometry | Essential for qualification |
Customer validation scenario
A semiconductor test socket manufacturer approved a conductive PA66 material after the supplier datasheet and plaque test appeared compliant. Three months later, 5-8% of sockets showed ESD failures, resistance varied from 10^5 to 10^9 ohm across different socket areas, and performance differed between batches. DEYU found that plaque data did not reveal gate-to-end variation, weld-line effects or part-to-part variation. After the customer implemented a three-level protocol, real part testing became the approval basis and ESD failure rate dropped to 0.5%.
What buyers should provide
Provide the part drawing or 3D model, gate and weld-line locations, resistance specification and standard, pellet data requirements, plaque geometry and method, real part test locations, environmental tests, sample size, molding parameters, service conditions, assembly methods, acceptance criteria, production volume, current material and known failures.
Conclusion
Pellet data and plaque data are necessary but not sufficient. Conductive plastic approval should end with real part data measured on the actual molded geometry and under realistic exposure. That is the only defensible way to predict ESD performance in production.